Eurostoxx futures -0.2% in early European trading
April 4, 2025 by admin
Filed under Forex Tips
Range Ratio MT4 Indicator – ForexMT4Indicators.com
April 4, 2025 by admin
Filed under Forex Tips
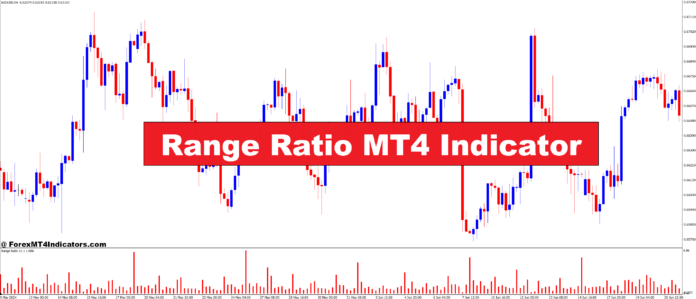
The Range Ratio MT4 Indicator is an essential tool for traders who want to better understand market volatility and price movements. In the fast-paced world of trading, one of the most significant challenges traders face is predicting market trends and determining the right entry and exit points. Without the right indicators, traders may find themselves making decisions based on emotions or incomplete information, leading to poor trading results. The Range Ratio MT4 Indicator offers a solution by giving traders a clear picture of market fluctuations and volatility. With its powerful functionality, it helps traders identify potential price shifts, making it a valuable addition to any trading strategy. Let’s dive into how this indicator works and why it’s a must-have for anyone trading on the MetaTrader 4 platform.
What is the Range Ratio MT4 Indicator?
The Range Ratio MT4 Indicator is a tool designed to help traders analyze market volatility. It works by comparing the current range of price movement to the average range over a specified period. This allows traders to understand if the market is experiencing higher or lower volatility than usual, which is a crucial factor in making accurate trading decisions. The indicator’s main function is to identify periods when price fluctuations are above or below average, providing valuable insights into potential breakouts or reversals.
For example, if the Range Ratio MT4 Indicator signals that price movement is unusually large compared to its historical average, it may indicate that the market is preparing for a breakout. Conversely, when the range is smaller than usual, it could suggest a period of consolidation or low volatility, allowing traders to prepare for potential market shifts. This kind of information is essential for timing trades effectively.
How the Range Ratio MT4 Indicator Works
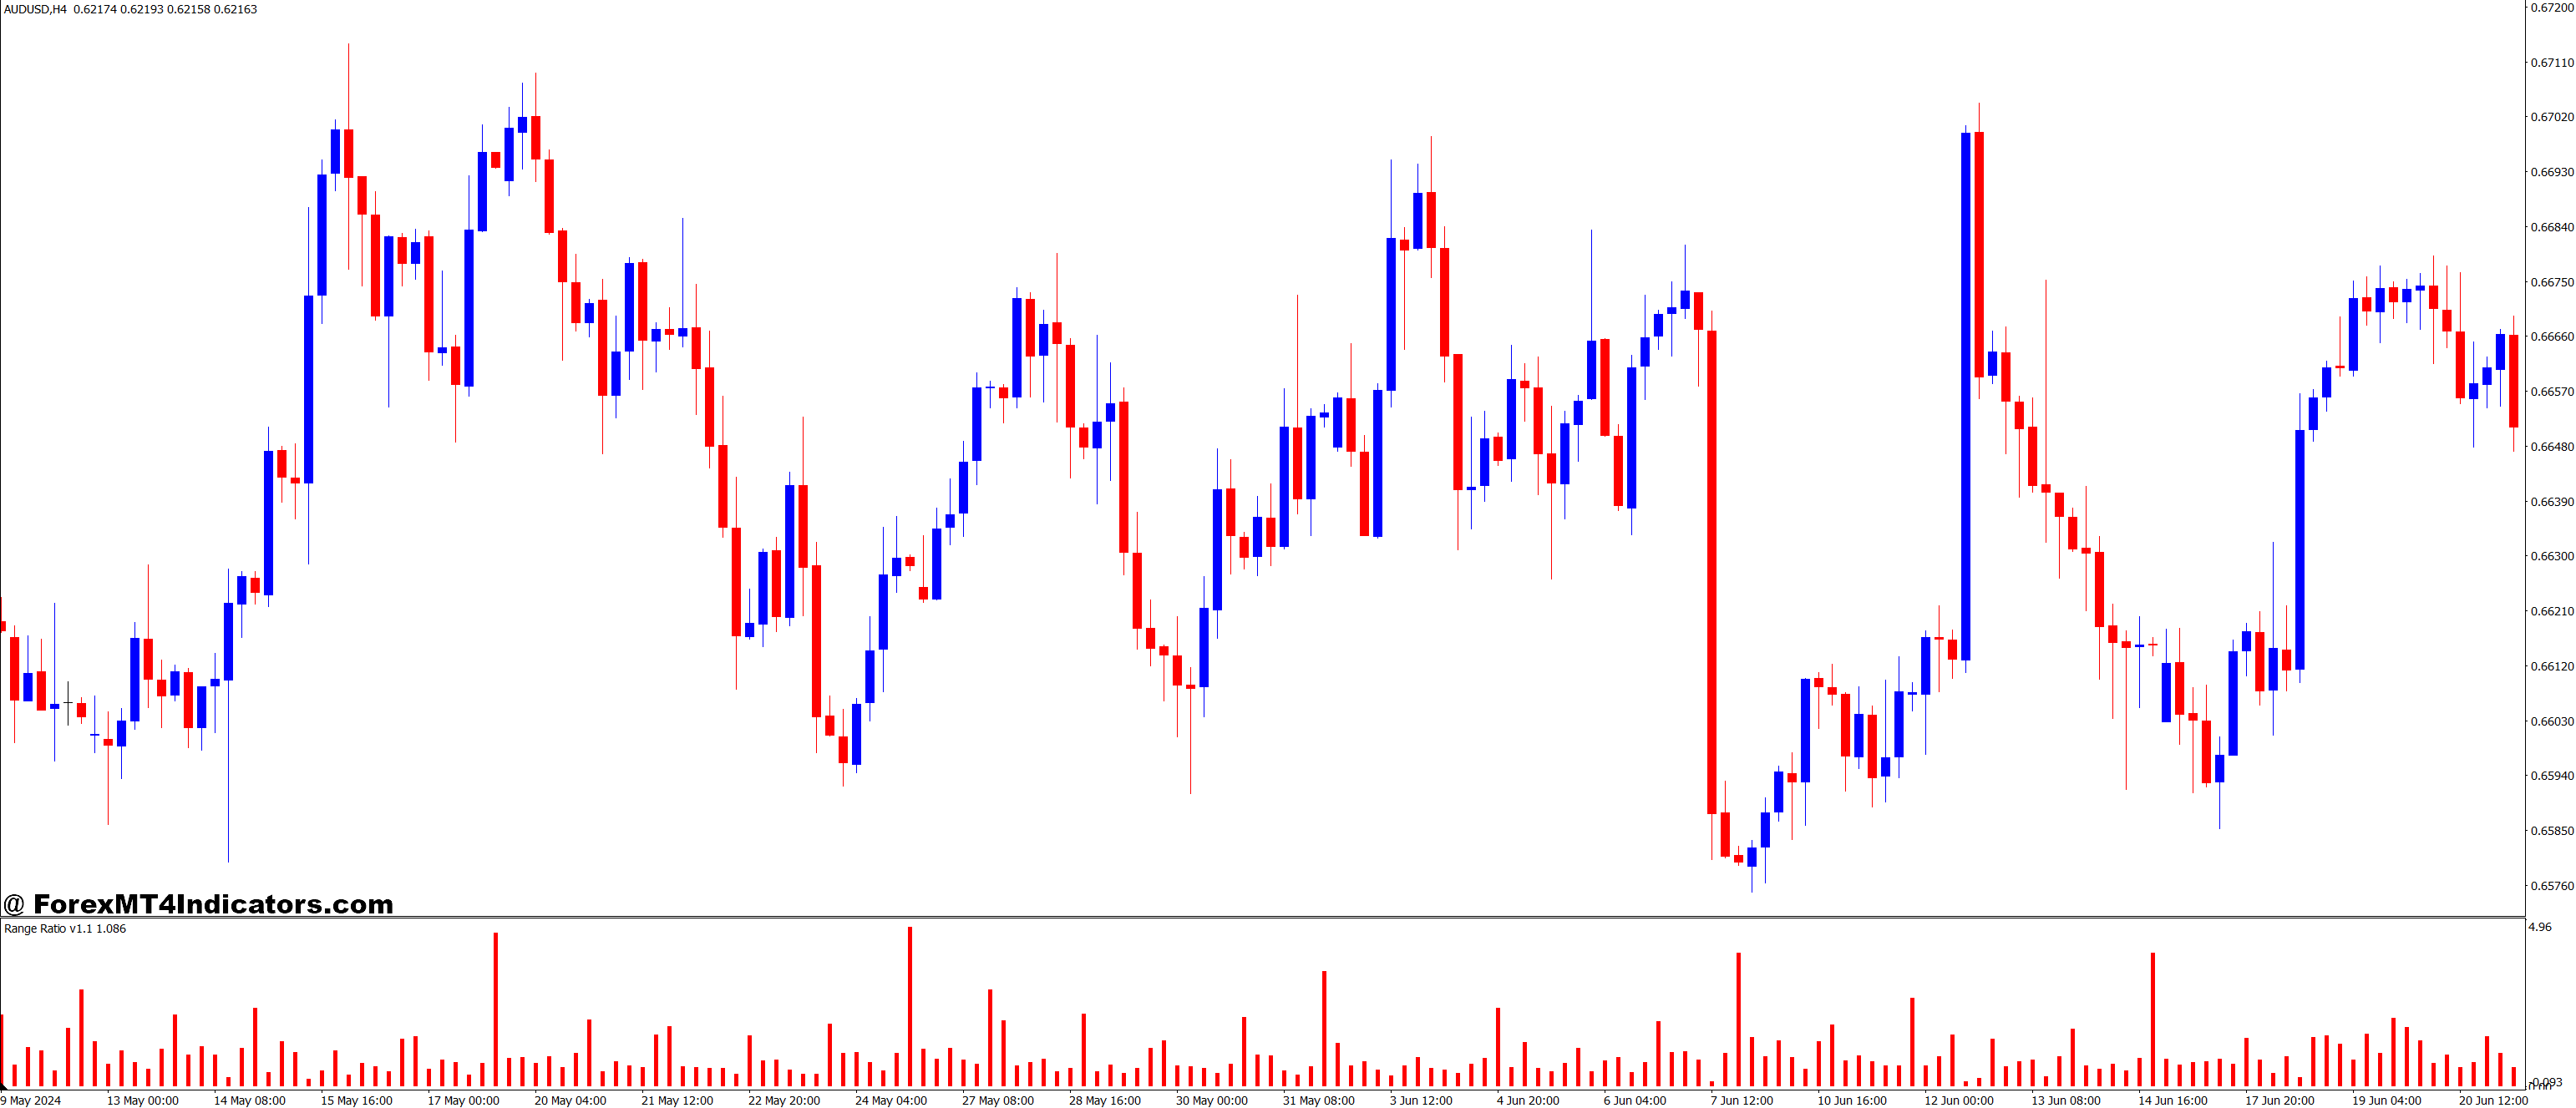
The Range Ratio MT4 Indicator is simple yet effective. It works by calculating the ratio between the current price range (the difference between the highest and lowest price during a given period) and the average price range over a set period. This data is then plotted on the MetaTrader 4 chart, giving traders an easy-to-read visual representation of market volatility.
For instance, if the current range is larger than average, the indicator will show a higher value, signaling increased volatility. If the range is smaller than usual, the value will decrease, suggesting lower volatility. This helps traders decide whether to enter or exit the market, as periods of high volatility may present more profit opportunities, while periods of low volatility may require more caution.
The Range Ratio MT4 Indicator also offers customization options. Traders can adjust the period over which the average range is calculated, allowing them to tailor the indicator to their trading style. Whether a trader is looking for short-term opportunities or long-term trends, this flexibility makes the indicator versatile enough to suit various strategies.
Benefits of Using the Range Ratio MT4 Indicator
-
Better Market Understanding: The Range Ratio MT4 Indicator provides a deeper understanding of market conditions by highlighting volatility. This knowledge helps traders avoid entering the market during periods of extreme uncertainty and focus on times when price movements are more predictable.
-
Enhanced Trade Timing: By showing whether volatility is increasing or decreasing, this indicator helps traders time their entries and exits more accurately. It allows traders to spot potential breakouts early, giving them a competitive edge in the market.
-
Simplicity and Ease of Use: One of the standout features of the Range Ratio MT4 Indicator is its simplicity. It’s easy to install and use, even for beginner traders. The clear visual representation makes interpreting the data and applying it to trading decisions straightforward.
-
Customizable to Fit Your Strategy: The indicator’s settings can be adjusted to suit different trading preferences. Whether you trade in short bursts or focus on longer-term trends, the Range Ratio MT4 Indicator can be adapted to your unique needs.
How to Use the Range Ratio MT4 Indicator Effectively
While the Range Ratio MT4 Indicator is powerful on its own, it’s most effective when combined with other technical analysis tools. Many traders use it alongside moving averages, Relative Strength Index (RSI), or MACD to get a fuller picture of market conditions. When the Range Ratio indicates increased volatility, traders may want to look for confirmation from other indicators to ensure they are making informed decisions.
Moreover, it’s important to use proper risk management practices when trading. No indicator, no matter how accurate, can guarantee profits in every situation. By using the Range Ratio MT4 Indicator as part of a broader strategy that includes stop-loss orders and careful position sizing, traders can manage risk while maximizing potential profits.
How to Trade with Range Ratio MT4 Indicator
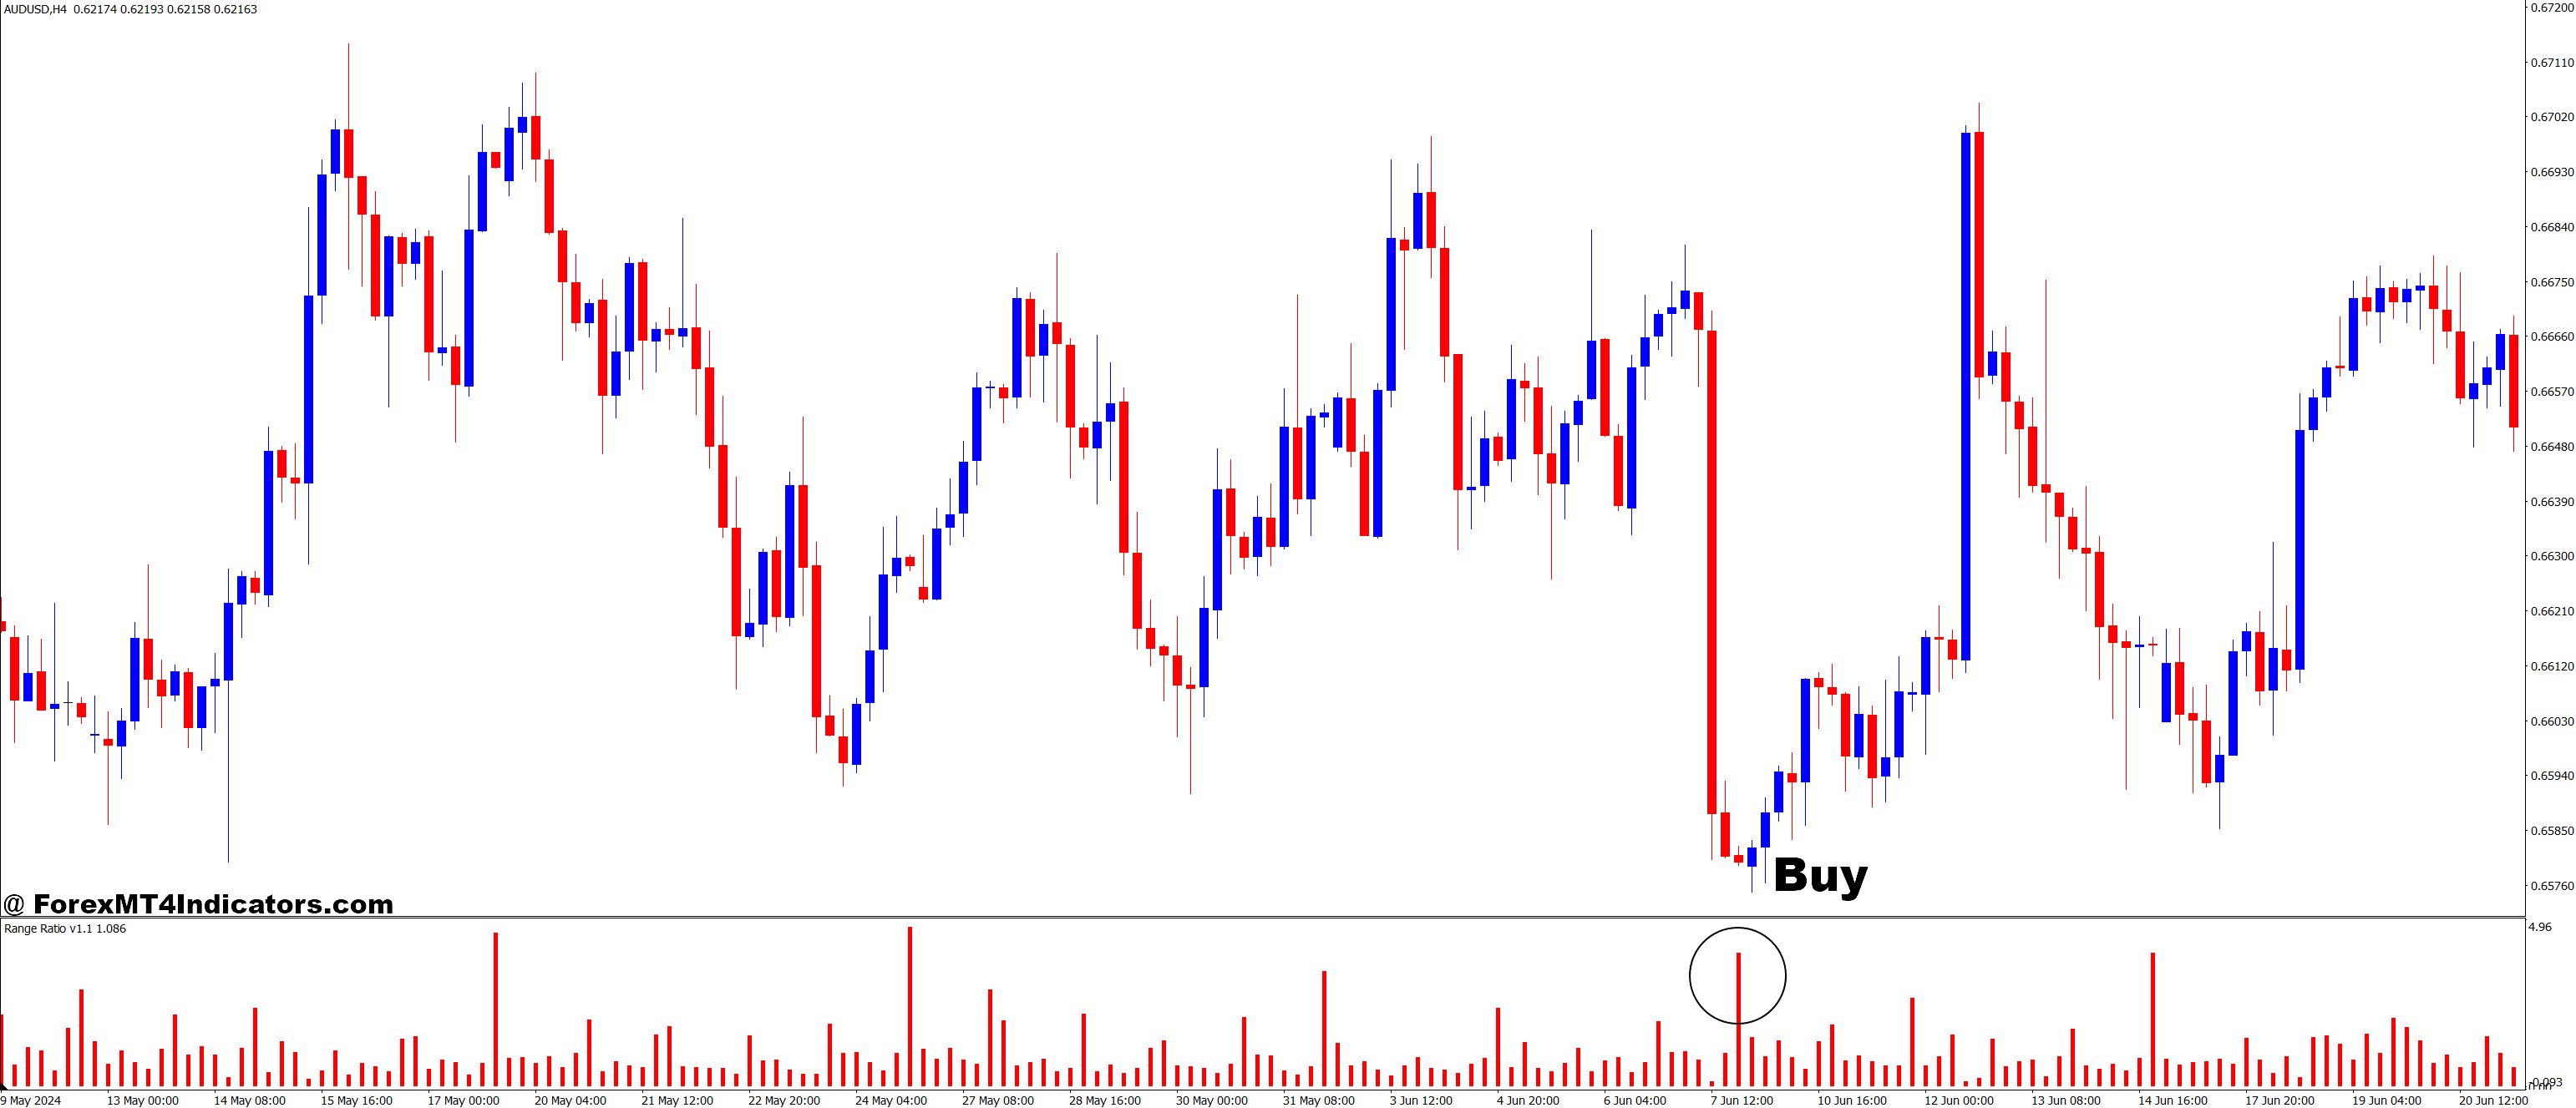
Buy Entry
- High Range Ratio: Look for a significant spike in the Range Ratio, indicating increased volatility.
- Breakout Confirmation: Price breaks above a key resistance level while the Range Ratio shows high volatility.
- Trend Direction: Confirm that the overall trend is bullish (use a moving average or trendline to verify).
- RSI Confirmation: RSI should not be in the overbought zone (ideally below 70).
- Candlestick Pattern: A bullish candlestick pattern, like a breakout candle or engulfing candle, forms at resistance.
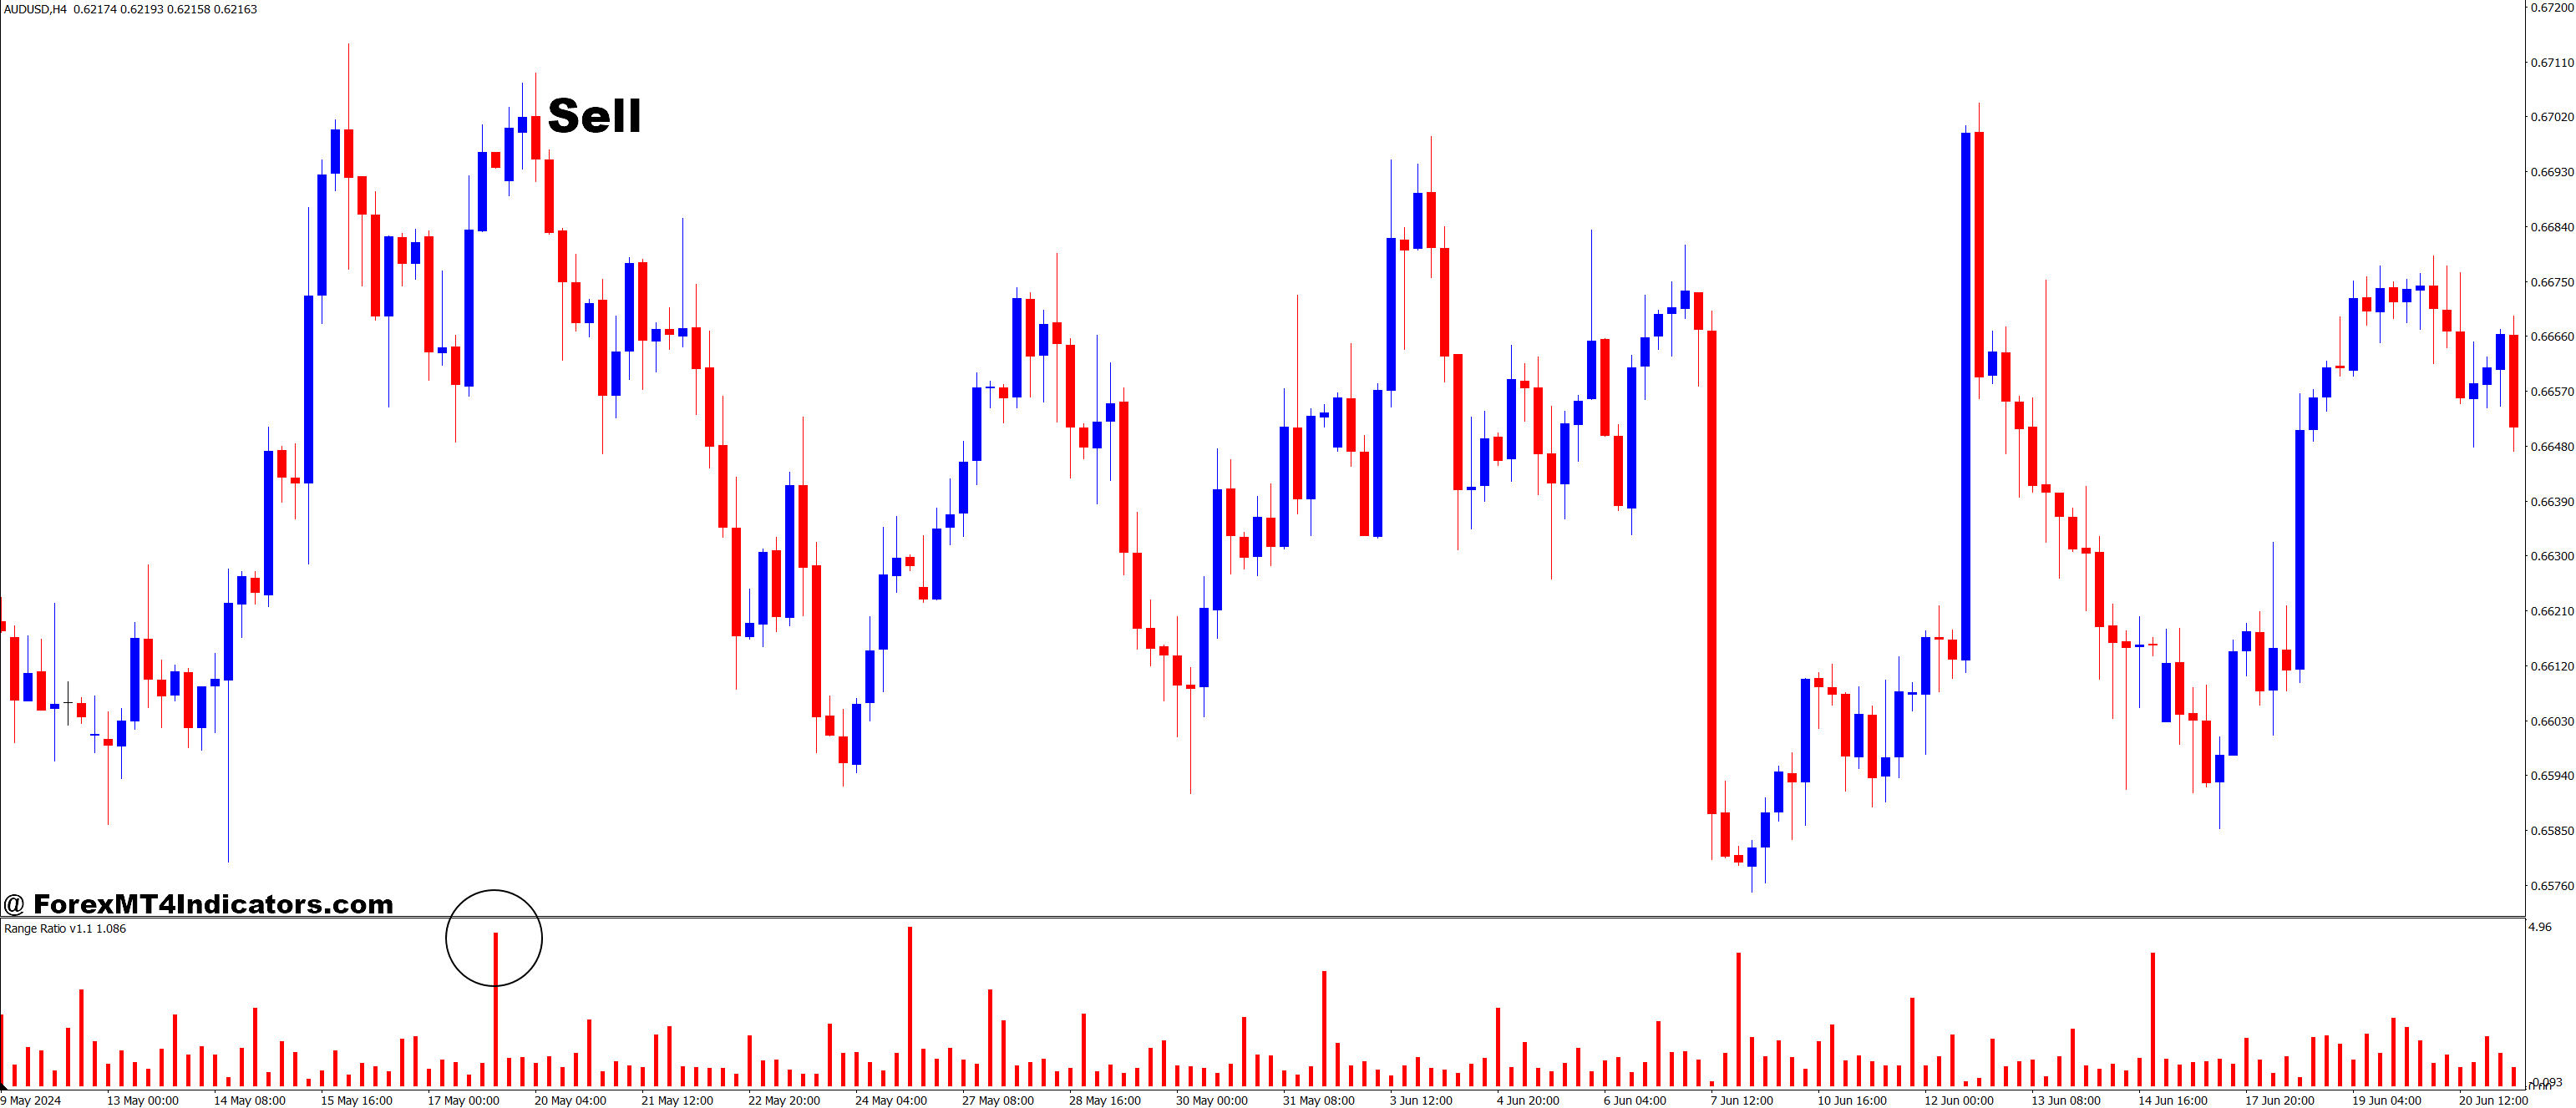
Sell Entry
- High Range Ratio: Look for a significant spike in the Range Ratio, indicating increased volatility.
- Breakdown Confirmation: Price breaks below a key support level while the Range Ratio shows high volatility.
- Trend Direction: Confirm that the overall trend is bearish (use a moving average or trendline to verify).
- RSI Confirmation: RSI should not be in the oversold zone (ideally above 30).
- Candlestick Pattern: A bearish candlestick pattern, like a breakdown candle or engulfing candle, forms at support.
Conclusion
The Range Ratio MT4 Indicator is a game-changer for traders who want to better understand market volatility and improve their trading decisions. Its ability to highlight changes in price range and volatility provides a clear advantage in predicting market movements and timing trades effectively. With its ease of use and flexibility, it’s a valuable tool for both beginners and experienced traders alike. By incorporating the Range Ratio MT4 Indicator into a broader trading strategy, traders can enhance their chances of success in the competitive world of financial markets.
Recommended MT4/MT5 Broker
XM Broker
- Free $50 To Start Trading Instantly! (Withdraw-able Profit)
- Deposit Bonus up to $5,000
- Unlimited Loyalty Program
- Award Winning Forex Broker
- Additional Exclusive Bonuses Throughout The Year
- Exclusive 50% Cash Rebates for all Trades!
Already an XM client but missing out on cashback? Open New Real Account and Enter this Partner Code: 𝟕𝐖𝟑𝐉𝐐
(Free MT4 Indicators Download)

Heads up – Australia switches off daylight saving this weekend
April 3, 2025 by admin
Filed under Forex Tips
Australia ends daylight saving this weekend.
Clocks will be turned back an hour on Sunday, April 6.
We call it Autumn here.
This article was written by Eamonn Sheridan at www.forexlive.com.
Source link
Bank of Japan Governor Ueda says US tariffs have raised uncertainty
April 3, 2025 by admin
Filed under Forex Tips
Amazing Oscilator MT4 Indicator – ForexMT4Indicators.com
April 3, 2025 by admin
Filed under Forex Tips
This tool is a game-changer for traders using MetaTrader 4, offering a simple yet powerful way to analyze market trends. By providing real-time insights into momentum and price movements, this indicator helps traders make more accurate decisions, ultimately improving their success rate. In this article, we’ll explore how the Amazing Oscillator works, its features, and how it can help you take your trading to the next level.
The Problem: Difficulty in Identifying Market Trends
For many traders, identifying market trends and timing trades accurately can be a challenge. Without proper indicators or tools, it’s difficult to predict whether prices will continue in their current direction or reverse. This can lead to missed opportunities, emotional decision-making, and even losses. Traders often find themselves stuck in a cycle of uncertainty, which can be frustrating and costly.
The Agitation: Why Missing Market Trends is Costly
When traders fail to identify trends accurately, they may end up making trades that aren’t in line with the market’s actual movement. This can lead to buying at high prices or selling at low prices, resulting in unnecessary losses. Additionally, traders who struggle with timing can miss out on profitable trades altogether. Without the right tools to track momentum and trends, trading becomes much more challenging, which is why the right indicator can be the difference between consistent profits and frequent losses.
The Solution: The Amazing Oscillator MT4 Indicator
Enter the Amazing Oscillator MT4 Indicator, a powerful tool designed to help traders easily spot market trends, manage risk, and make more informed decisions. By calculating the difference between the 5-period and 34-period moving averages, this indicator offers valuable insights into market momentum. The Amazing Oscillator provides clear buy or sell signals, helping traders know exactly when to enter or exit a trade. For traders using MetaTrader 4, this indicator is a game-changer, allowing them to stay ahead of market movements and make smarter trading choices.
How the Amazing Oscillator MT4 Indicator Works
The Amazing Oscillator operates by calculating the difference between two moving averages: a fast 5-period and a slower 34-period moving average. This calculation helps traders spot market momentum and recognize whether a trend is strong or weakening. When the oscillator crosses above the zero line, it signals a potential buying opportunity, while crossing below the zero line suggests a selling opportunity. The clear visual cues make it easier for traders to recognize when the market is in a bullish or bearish phase.
Moreover, the Amazing Oscillator can be used on multiple timeframes, giving traders the flexibility to adapt it to their trading style. Whether you’re a day trader, scalper, or swing trader, this tool offers a range of uses. It’s especially helpful for those who prefer to trade short-term price movements or who want to identify entry and exit points with precision.
Managing Risk with the Amazing Oscillator
One of the greatest strengths of the Amazing Oscillator is its ability to help traders manage risk. By providing signals based on momentum and price movements, it helps traders avoid holding onto positions for too long or entering trades at the wrong time. For instance, if a trader sees the oscillator moving into negative territory while holding a long position, it can serve as an early warning to exit the trade before significant losses occur.
Additionally, traders can use the oscillator to spot potential reversals in the market. Divergence between the price action and the oscillator is a key sign of possible trend reversal. If the price is moving in one direction but the oscillator is moving in the opposite direction, this could indicate a shift in market sentiment. Identifying these signals early can help traders exit losing positions and take advantage of new trends before they fully develop.
Versatility Across Different Markets
Another advantage of the Amazing Oscillator is its versatility. It works well across different financial markets, from forex to stocks and commodities. Traders can adjust the indicator’s settings to fit their preferred timeframes and asset types, making it adaptable to various strategies. Whether you are trading volatile forex pairs or slower-moving stocks, the Amazing Oscillator can be customized to match your needs, offering value for both beginners and seasoned traders.
How to Trade with Amazing Oscillator MT4 Indicator
Buy Entry
- Bullish Crossover: Look for the Amazing Oscillator to cross above the zero line. This suggests increasing bullish momentum and a potential buying opportunity.
- Green Bars: When the indicator produces green bars (above the zero line), it signals a continuation of upward momentum, making it a good time to enter a long (buy) position.
- Convergence: If the price is making higher lows and the oscillator confirms with higher peaks, this can indicate strong upward momentum and a potential buy.
- Divergence: If the price has been making lower lows while the oscillator is making higher lows, this positive divergence suggests a reversal to the upside, which can be a buy signal.
Sell Entry
- Bearish Crossover: Look for the Amazing Oscillator to cross below the zero line. This indicates increasing bearish momentum and a potential selling opportunity.
- Red Bars: When the oscillator produces red bars (below the zero line), it signals a continuation of downward momentum, making it a good time to enter a short (sell) position.
- Convergence: If the price is making lower highs and the oscillator confirms with lower peaks, this suggests strong bearish momentum, signaling a sell.
- Divergence: If the price has been making higher highs while the oscillator is making lower highs, this negative divergence suggests a potential reversal to the downside, which can be a sell signal.
Conclusion
The Amazing Oscillator MT4 Indicator is an essential tool for traders looking to improve their performance. With its clear buy and sell signals, risk management capabilities, and flexibility across multiple markets, this indicator is a valuable asset for both novice and experienced traders. By incorporating the Amazing Oscillator into your trading strategy, you can make more informed decisions, manage risks more effectively, and ultimately increase your profitability. If you’re ready to take your trading to the next level, the Amazing Oscillator is the tool you’ve been waiting for.
Recommended MT4/MT5 Broker
XM Broker
- Free $50 To Start Trading Instantly! (Withdraw-able Profit)
- Deposit Bonus up to $5,000
- Unlimited Loyalty Program
- Award Winning Forex Broker
- Additional Exclusive Bonuses Throughout The Year
- Exclusive 50% Cash Rebates for all Trades!
Already an XM client but missing out on cashback? Open New Real Account and Enter this Partner Code: 𝟕𝐖𝟑𝐉𝐐
(Free MT4 Indicators Download)

BOJ dep gov Uchida says will raise rates if inflation rises and economy improves
April 3, 2025 by admin
Filed under Forex Tips
Bank of Japan Deputy Governor Uchida
-
Will raise interest rates if underlying inflation heightens against background of continued improvements in economy
-
We will examine, without any preset idea, whether our economic, price forecasts laid out in our quarterly report will be achieved
-
We will scrutinise at each meeting economic, price developments and risks including impact from U.S. tariffs
-
Trump tariffs likely to put downward pressure on Japan, global economies
-
There are various upside, downside impacts on prices that could come from Trump tariffs
- Trump tariffs could push down prices if they cool economy, but may push up prices via impact on global supply chains
- Trump tariffs could affect prices via market, FX moves
more to come
This article was written by Eamonn Sheridan at www.forexlive.com.
Source link
Morgan Stanley raising around 100 billion yen for Japan-focused real estate fund
April 3, 2025 by admin
Filed under Forex Tips
Morgan Stanley raising around 100 billion yen for Japan-focused real estate fund
- Morgan Stanley fund is due to close in June
Headlines via Reuters citing unnamed sources
This article was written by Eamonn Sheridan at www.forexlive.com.
Source link
Hong Kong and China market holiday Friday, April 4, 2025 – Ching Ming Festival
April 3, 2025 by admin
Filed under Forex Tips
With mainland and Hong Kong markets out today, trading linked are also closed. ,
What are these ‘trading links’?
Shanghai-Hong Kong Stock Connect is one:
- a mutual market access program through which investors in each market can trade shares on the other market directly
- launched in 2014
- Northbound Trading allows international and Hong Kong investors to trade eligible shares listed on the Shanghai Stock Exchange via the Hong Kong Stock Exchange.
- Southbound Trading allows mainland Chinese investors to trade eligible shares listed on the Hong Kong Stock Exchange via the Shanghai Stock Exchange.
- The Shanghai-Hong Kong Stock Connect allows foreign investors to access China’s A-shares market (shares in mainland China-based companies that were previously difficult for foreign investors to access) and it allows mainland Chinese investors to access the Hong Kong market.
In addition to the Shanghai-Hong Kong Stock Connect, there is also the Shenzhen-Hong Kong Stock Connect
- launched in 2016
- links Shenzhen Stock Exchange with the Hong Kong Stock Exchange in a similar way
Forexlive Americas FX news wrap 3 Apr; The USD, stocks and bond yield tumble on tariffs
April 3, 2025 by admin
Filed under Forex Tips
US stocks got hit hard. US yields moved sharply lower. The USD fell sharply after the tariff announcements late yesterday.
Yesterday Pres. Trump announced reciprocal tariffs against most countries. Below are the tariffs against major US export countries:
-
Canada: 10% baseline tariff.
-
Mexico:10% baseline tariff
-
China: 34% tariff.
-
Japan: 24% tariff.
-
Germany: 20% tariff (as part of the European Union).
-
South Korea: 25% tariff
-
United Kingdom: 10% baseline tariff
-
France: 20% tariff (as part of the European Union)
-
India: 26% tariff.
-
Taiwan: 32% tariff.
Looking at the USD, it fell the hardest vs the CHF. The CHF benefitted the most from flight to safety flows despite tariffs being hiked by 31%. The USD fell -2.47% against the CHF.
The JPY was another beneficiary even though autos will be a big headwind for Japan. Japanese automakers heavily rely on the U.S. market, with a substantial portion of their vehicles imported either directly from Japan or via manufacturing facilities in other countries. For instance, in 2024, major Japanese carmakers exported nearly 880,000 vehicles to the U.S. from Mexico alone. Cars arriving from Japan on or after April 9, 2025 will have a 25% tariff + 2.5% import duty + 24% reciprocal tariff for a total cumulative tariff of 51.5%. Ouch.
For today, the USDJPY fell -2.06%
The dollar also fell:
- -1.66% vs the EUR
- -1.03% vs the CAD
- -0.73% vs the NZD
- -0.61% vs the GBP
- -0.38% vs the AUD
Although the USD fell vs the major currencies, it also rebounded in the US session.
A rebound did not happen in the US stock market. The major indices tumbled sharply with the Nasdaq index falling near 6% which was the 4rd largest one-day decline going back to at least 2015 (the other 3 were in March 2020).
The final numbers for the day are showing:
- Dow industrial average fell $-1679.39 or -3.98% at 40,545.93. That was the worst day since June 2020
- S&P index fell -274.45 points or -4.84% at 5396.52. That was its worst day since June 2020
- NASDAQ index fell -1050.44 points or -5.97% at 16550.61. That was its worst decline since March 16, 2020.
In the US debt market, yields are also sharply lower as investors prepare for a recession:
- 2 year yield 3.687%, -21.6 basis points. The yield is in its lowest level since October 3. The low yield for 2024 was at 3.508%
- 5-year yield 3.729%, -22.3 basis points. The yield is lowest since October 4.
- 10 year yield 4.032%, -16.3 basis points. The yield is low since October 4
- 30 year yield 4.474%, -7.7 basis points. The yield is still higher than the lowest level in March which came in at 4.424%.
In other markets:
- Crude oil fell sharply on the combination news of lower global growth as a result of tariffs and a potential trade war, and comments from OPEC+ that it would increase crude production faster than previously announced. The price of crude oil fell $-5.10 or -7.11% and $66.61.
- Gold prices also fell surprisingly by $-23.95 or -0.76% to $3114.28.
- Silver fell $2.06 or -6.09% at $31.82.
- Bitcoin felt $196 or -0.24% and $82,333. The low price extended to $81,200. The high price was at $83,896.
Reserve Bank of New Zealand is expected to cut its cash rate again on April 9
April 3, 2025 by admin
Filed under Forex Tips
The Reserve Bank of New Zealand (RBNZ) is expected to lower its official cash rate by 25 basis points to 3.50% on April 9, according to a Reuters poll of 31 economists—all of whom forecast this move.
- This cut would be the fifth in a row, bringing the total reduction since August 2024 to 175 basis points, as the central bank continues to support an economy emerging from recession.
- Looking ahead, most economists (24 of 27) expect another 25-basis-point cut in May, and the median forecast suggests rates will reach 3.00% by Q3 2025.
- Some expect the rate to fall even further by year-end.
The RBNZ had already hinted at April and May cuts during its February meeting, with inflation expected to remain within its 1%-3% target range. The central bank sees 3.00% as the neutral rate, suggesting room for further easing.
Compared to other central banks like the RBA and the Fed, the RBNZ’s stance is notably more dovish.
RBNZ Governor Orr resigned abruptly in March.


