A technical look at the EURUSD, USDJPY and GBPUSD ahead of the US jobs report
April 4, 2025 by admin
Filed under Forex Tips
Two days after Liberation Day is not looking good for the markets. The USD fell yesterday with the CHF and the JPY leading the way. The dollar is mixed today as the flow of funds start to go out of AUD and NZD as China retaliates with their own 34% rise in tariffs. The AUDUSD is down -3.54%. The NZDUSD is down -2.58% in a morning snapshot.
On the downside the USD is down another 1.06% vs the CHF and -0.66% vs the JPY. For the EURUSD it is up 0.17% (lower USD), while the GBPUSD is down -0.63% (higher USD).
So price action is all over the place to start the day. In the video above, I take a look at the 3 major currency pairs – the EURUSD, USDJPY, and GBPUSD. What levels are in play, what targets and risk levels should you watch and why.
By the way, the US jobs report will be released at 8:30 AM ET. What is expected?
- Consensus estimate +135K
- Estimate range +50K to +185K
- February was +151K
- Private consensus +135K versus +151K prior
- Unemployment rate consensus estimate 4.1% versus 4.1% prior
- Prior unrounded unemployment rate 4.1396%
- Prior participation rate 62.4%
- Prior underemployment U6 8.0%
- Avg hourly earnings y/y exp +3.9% versus +4.0% prior
- Avg hourly earnings m/m exp +0.3% versus +0.3% prior
- Avg weekly hours exp 34.2 versus 34.1 prior
Numbers released so far this month:
- ADP report +155K versus +84K prior
- ISM services employment 46.2 vs 53.9 prior
- ISM manufacturing employment 44.7 vs 47.6 prior
- Challenger job cuts 275.2k vs 172.0k prior
- Philly employment +19.7 vs +5.3 prior
- Empire employment -4.1 vs -3.6 prior
- Initial jobless claims survey week 225K vs 219K prior
The strongest argument for a good number in March is that February jobs (particularly in leisure & hospitality) were depressed by poor weather. Canada will also release their jobs report at the bottom of the hour. I’m not sure that the market really cares about these reports given the changes over the last few days.
“By the way Part II”, Fed’s Powell will have the opportunity to add his two-cents in regard to the economics of the tariffs. Yesterday Fed Jefferson kinda kicked the can down the road, not being overly reactionary to what was a rout in the markets. Who is that looking over Powell’s shoulder.
The US stocks are bouncing modestly from an hour or so ago but are still down sharply in pre-market trading. A snaphot of the market currently shows:
- Dow industrial average -1284 points. Yesterday, the index fell -1679 points or -3.98%
- S&P index is down -176 points. Yesterday the index fell -274.45 points part -4.84%.
- NASDAQ index is trading down -629 points. Yesterday the index fell -1050.44 points or -5.97%.
The declines in the S&P and the NASDAQ indices were the largest since the 2020 pandemic selloff.
In the US debt market yields are continuing their slide:
- 2- year yield 3.543%, -18 basis points
- 5-year yield 3.595% -16.3 basis points
- 10 year yield 3.910% -14.5 basis points.
- 30 year yield 4.364% -12.0 basis points
Crude oil continues its tumble on concerns of global slowdown. The price is down $5.26 or -7.86% $61.69.
The price of gold is moving to the downside despite the risk sentiment and any flight to safety advantages of gold. The price is down $17.79 or -0.57% at $3097.
Bitcoin is amazingly stable at $-853 or -1.03% at $82,284.
Risk-off flows intensify ahead of US trading
April 4, 2025 by admin
Filed under Forex Tips
The market moves are intense at the moment, as China delivers sweeping counter-tariffs against the US here. It’s a bit of a case of blink and you’ll miss it, with the price movements coming in thick and fast. In FX, we’re already seeing USD/JPY tumble below 145.00 now to fresh lows – down by 1% on the day.
Elsewhere, S&P 500 futures are down 3% and in Europe we’re seeing the DAX down by nearly 5% and CAC 40 down by 4%. As crazy as it sounds, we’re getting so close to talking about the DAX erasing all of its gains for the year when at some point last month it was up by close to 18% year-to-date. Baffling.
Going back to FX, the aussie is being crushed hard with traders now fully expecting the RBA to deliver rate cuts next month and all the way through to August at least. In the next three meetings, traders are pricing in ~86 bps worth of rate cuts currently. That is seeing AUD/USD tumble by over 3% now to 0.6117 on the day. The Pacific peso is back.
In other markets, gold is one of the biggest beneficiaries here as the precious metal has surged up from around $3,090 to $3,133. It is up 0.6% now after having been down by around 1% at the lows earlier in the session.
Meanwhile, 10-year Treasury yields are also hammered down to 3.878% currently – down 16 bps on the day. For some context, yields touched a high of 4.40% just last Thursday. So, we’re seeing it down by over ~53 bps from the highs in just a little over a week.
This article was written by Justin Low at www.forexlive.com.
Source link
Risk sentiment takes another blow as China responds with counter-tariffs
April 4, 2025 by admin
Filed under Forex Tips
This is seeing the overall risk mood slide back lower as we look towards US trading later. Trump’s tariffs announcement two days ago is just the start of all this uncertainty. The retaliations and negotiations are all part of what markets have to deal with next and China’s response is one of the bigger ones. And it looks like they’re choosing to go blow for blow, at least for now. There’s still about a week before the tariffs officially go into effect.
S&P 500 futures have now tumbled down by 1.5% and 10-year yields in the US have tripped to 3.90%, down 15 bps on the day.
US Treasury 10-year yields (%) daily chart
In turn, USD/JPY has also slid from 146.30 to 145.80 at the moment as risk sentiment takes another blow ahead of US trading later.
Japan PM Ishiba: I want to set up a tariffs response headquarters soon
April 4, 2025 by admin
Filed under Forex Tips
- I want to set up a tariffs response headquarters soon.
- Trying to set up a phone call with Trump first.
- I was asked to have a call with Trump soon.
- Explained government measures on tariffs to party leaders.
World leaders are trying to decide on the appropriate response to Trump’s tariffs. Ishiba said that the imposition of the tariffs is a looming national crisis that requires an unprecedented response.
He’s leaving the door open for retaliatory measures or take the issue to the WTO. Analysts expect the tariffs to push down Japan’s growth by 2.9% in the medium-term.
This article was written by Giuseppe Dellamotta at www.forexlive.com.
Source link
Precious metals continue to struggle towards the end of the week
April 4, 2025 by admin
Filed under Forex Tips
The most notable thing about the tariffs for precious metals is that they were somewhat excluded from it. The tariffs made an exemption to “bullion” and that is leading to some readjustment it would seem in precious metals and some industrial metals this week. Silver is down another 2% today after having fallen by 6% in trading yesterday:
Silver (XAG/USD) daily chart
The fall now draws in the 100-day moving average (red line) with the 200-day moving average (blue line) also not too far away at $30.90. Those will be key levels to watch out for in the spot price above.
But the story for silver and why it is suffering is perhaps one that is better explained in the futures market.
Amid the risk of being slapped with tariffs, there was a surge in US premiums for precious metals as traders moved to cover short positions. That resulted in a widening differential between the front-month Comex prices and that for spot gold in London. The differential can be coined as “exchange for physical” (EFP).
In essence, that makes for an arbitrage opportunity in which resulted in an influx in physical shipments of these precious metals to the US.
However, as “bullion” is now excluded from tariffs, that differential has now evaporated and it does sort of put an end to the surge in precious metal flows to the US as a result.
Silver EFP
The differential tumbled from $1.00 to as low as $0.24 in the aftermath of Trump’s tariffs announcement.
In any case, this is just one part of the story. I would argue that a collapse in EFP is not necessarily the most bearish thing for prices in the big picture. At the end of the day, it’s still all about the moving parts in Trump’s tariffs.
Heightened global recession risks is still arguably the main thing that will impact silver and other industrial metals especially.
As for gold, it’s a slightly different story. Yes, what happened with silver above also happened with gold. But do be reminded that gold also holds many other key properties that are not likened to silver.
It is still a key hedge in times of uncertainty and a global economic slowdown. Besides its status as a haven asset, gold is also the hot commodity reserve of choice at the moment as central banks around the world are looking for a way to keep a strong “war chest”. The graphic below continues to show strong central bank buying activity over the last two years:
h/t @ Marissa Salim
And not to mention the fact that major central banks are also seeing increasing odds of adding to rate cuts now amid rising recession risks.
So while gold has not quite found its footing yet in the early days to the reaction of Trump’s tariffs, there is still strong reasons to expect that it will bounce back better than its peers should the tariffs narrative stay the course.
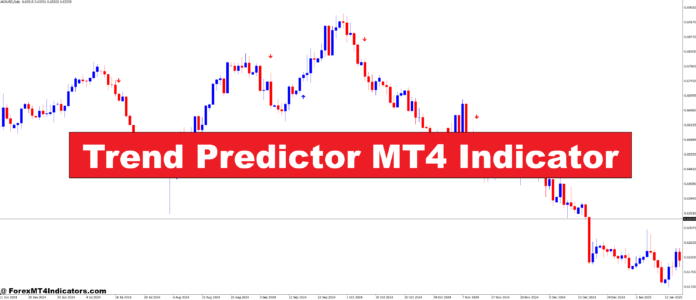
Trend Predictor MT4 Indicator – ForexMT4Indicators.com
April 4, 2025 by admin
Filed under Forex Tips
The Trend Predictor MT4 Indicator is a specialized tool designed for traders using MetaTrader 4 (MT4) to analyze market trends. Its primary function is to identify the prevailing direction of the market by using historical data and advanced algorithms. This indicator generates clear buy or sell signals, making it easier for traders to understand when to enter or exit a trade. Whether you’re new to forex or an experienced trader, the Trend Predictor simplifies the process of trend forecasting, reducing the guesswork involved in making trading decisions.
How Does the Trend Predictor MT4 Indicator Work?
The Trend Predictor MT4 Indicator works by examining past price movements and detecting patterns that signal potential future trends. Once these trends are identified, the indicator provides visual alerts on your MT4 chart, highlighting when the market is likely to trend upward or downward. These alerts can be customized to suit different trading strategies, allowing traders to adjust the settings based on their preferences. By offering these clear and timely signals, it helps traders stay ahead of the curve and make more confident decisions in real time.
Benefits of Using the Trend Predictor MT4 Indicator
One of the biggest advantages of the Trend Predictor MT4 Indicator is its ease of use. Even beginners can take advantage of its features without needing a deep understanding of technical analysis. The clear buy and sell signals make it easy to spot trading opportunities and stay on the right side of the market. Additionally, the indicator is highly customizable, making it versatile for different trading styles. Whether you’re trading on short-term charts or looking for long-term trends, the Trend Predictor adapts to your needs, making it a valuable asset for any trader.
Why You Should Combine It with Other Tools
Although the Trend Predictor MT4 Indicator is a powerful tool, no indicator is perfect. Traders should remember that relying solely on one tool can sometimes lead to false signals. It’s best to combine the Trend Predictor with other analysis tools like support and resistance levels or fundamental analysis for more accurate predictions. Additionally, practicing good risk management is essential to protect your capital and maximize profits. When used in conjunction with other strategies, the Trend Predictor MT4 Indicator can significantly enhance the effectiveness of your trading approach.
How to Trade with Trend Predictor MT4 Indicator
Buy Entry
- Wait for the Trend Predictor MT4 Indicator to show a clear upward trend signal (usually marked with an arrow or color change on the chart).
- Ensure that the trend remains consistent across multiple timeframes (if applicable).
- Confirm the signal with other indicators or support levels (optional but recommended for more confirmation).
- Place a buy order once the signal appears, entering the market in the direction of the trend.
- Set a stop loss below the most recent swing low to manage risk.
- Set a take profit level at the next resistance level or based on your preferred risk-to-reward ratio.
Sell Entry
- Wait for the Trend Predictor MT4 Indicator to show a clear downward trend signal (usually marked with an arrow or color change on the chart).
- Confirm the downward trend with other indicators or resistance levels (optional but recommended).
- Place a sell order when the signal appears, entering the market in the direction of the trend.
- Set a stop loss above the most recent swing high to minimize risk.
- Set a take profit level at the next support level or according to your risk-to-reward strategy.
Conclusion
The Trend Predictor MT4 Indicator is a must-have tool for forex traders looking to improve their market analysis and make more profitable trades. By providing clear, actionable signals, it helps traders stay on top of market trends and make better-informed decisions. However, like any tool, it works best when paired with other techniques and strategies. If you’re ready to take your trading to the next level, integrating the Trend Predictor into your strategy could be the key to achieving success in the forex market.
Recommended MT4/MT5 Broker
XM Broker
- Free $50 To Start Trading Instantly! (Withdraw-able Profit)
- Deposit Bonus up to $5,000
- Unlimited Loyalty Program
- Award Winning Forex Broker
- Additional Exclusive Bonuses Throughout The Year
- Exclusive 50% Cash Rebates for all Trades!
Already an XM client but missing out on cashback? Open New Real Account and Enter this Partner Code: 𝟕𝐖𝟑𝐉𝐐
(Free MT4 Indicators Download)

Eurostoxx futures -0.2% in early European trading
April 4, 2025 by admin
Filed under Forex Tips
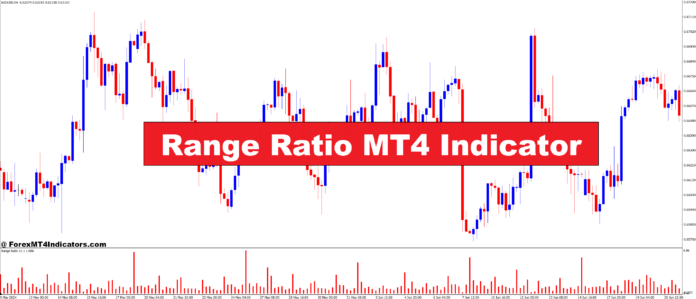
Range Ratio MT4 Indicator – ForexMT4Indicators.com
April 4, 2025 by admin
Filed under Forex Tips
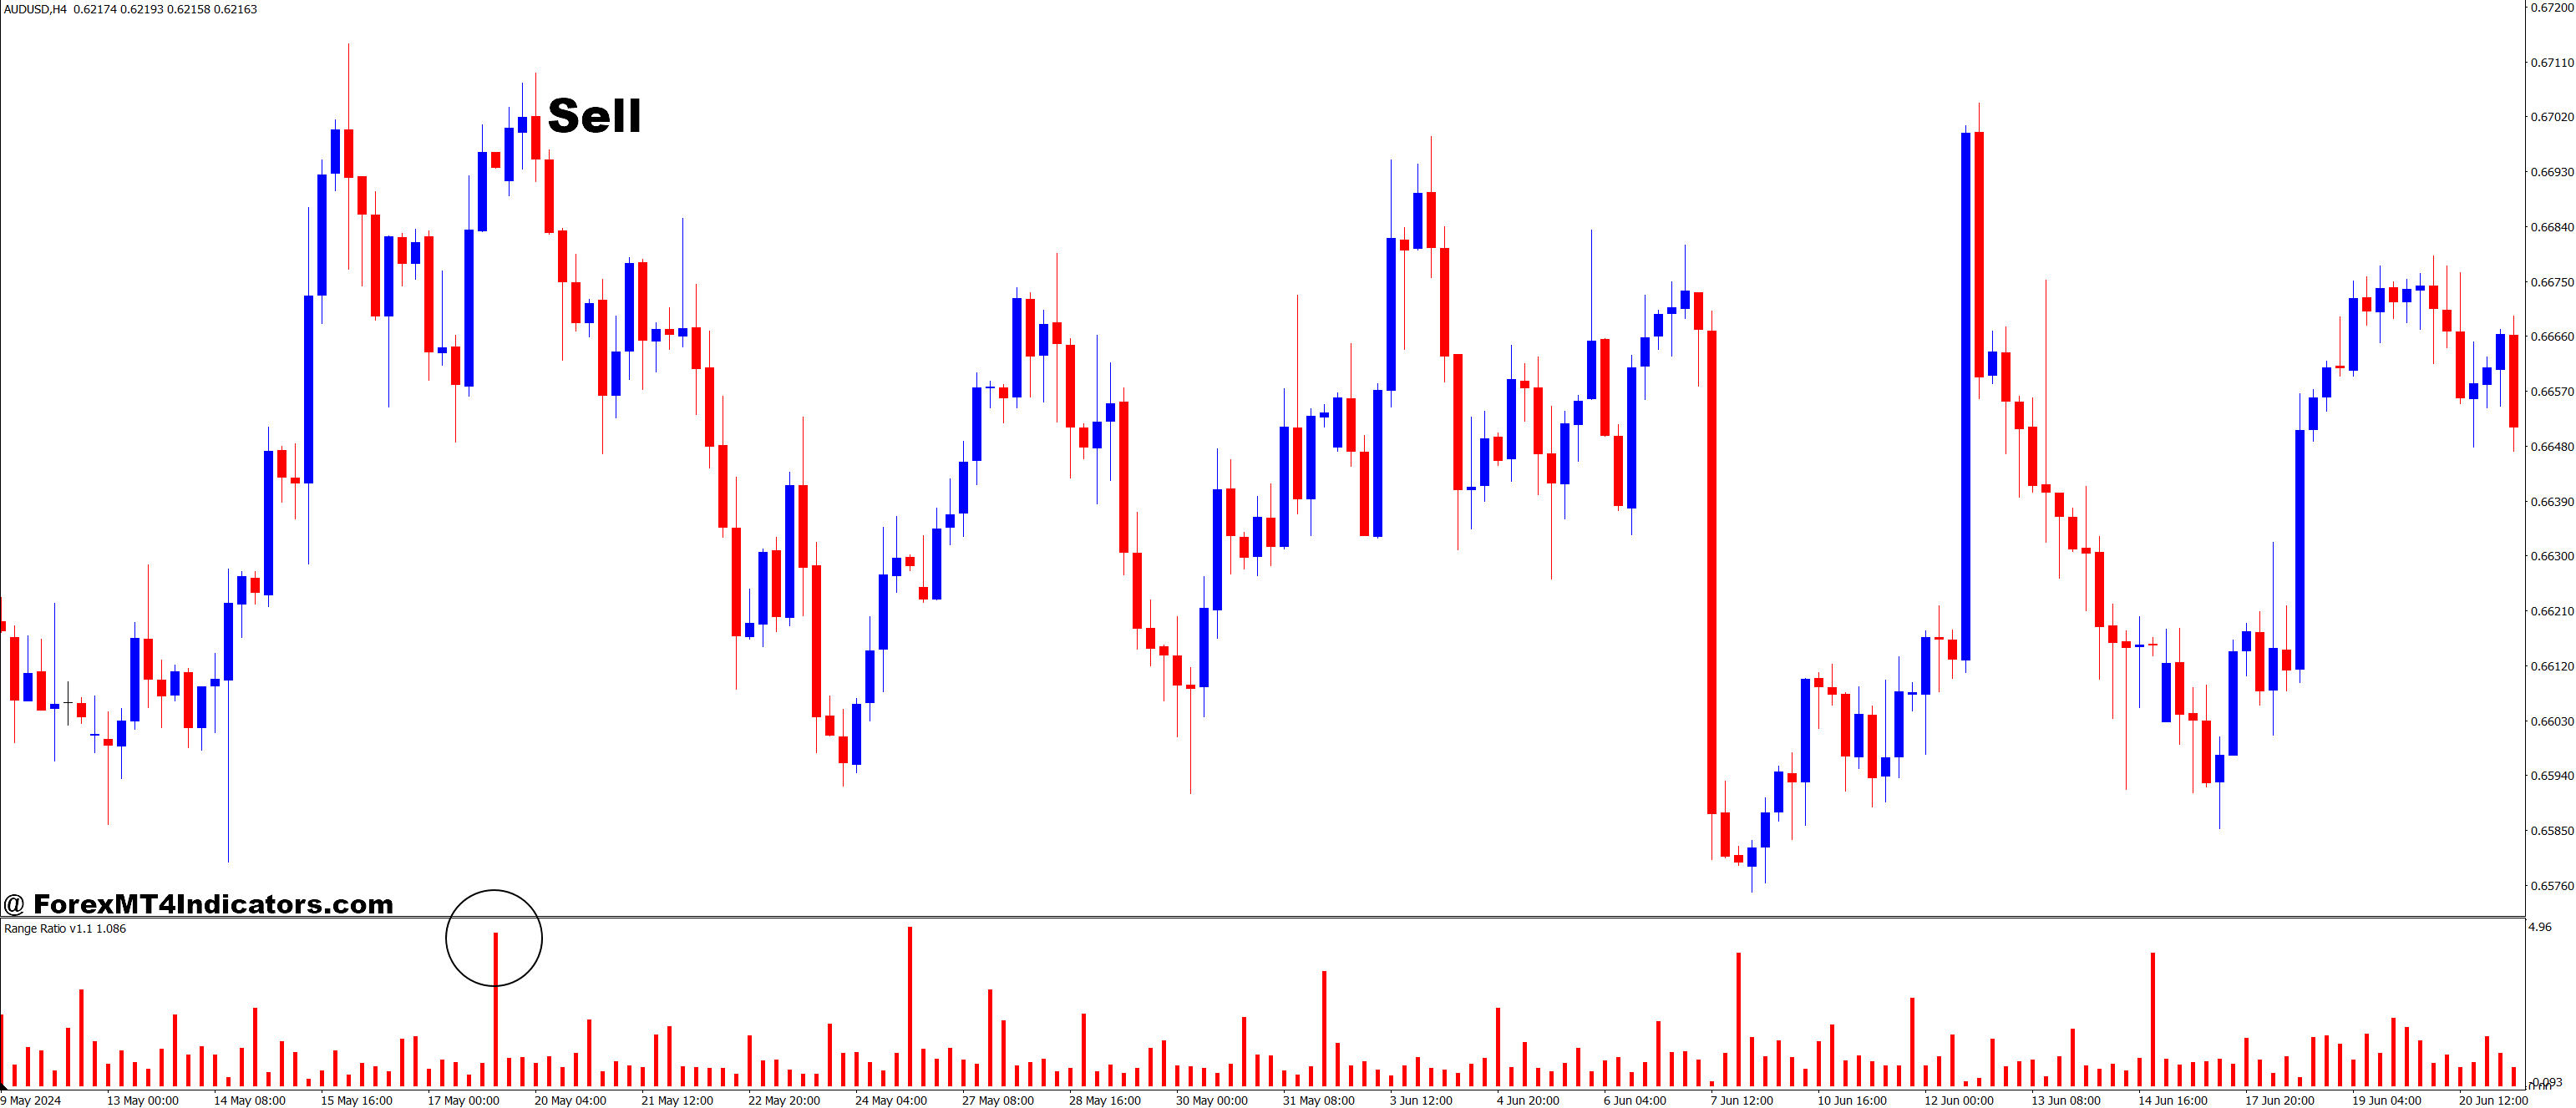
The Range Ratio MT4 Indicator is an essential tool for traders who want to better understand market volatility and price movements. In the fast-paced world of trading, one of the most significant challenges traders face is predicting market trends and determining the right entry and exit points. Without the right indicators, traders may find themselves making decisions based on emotions or incomplete information, leading to poor trading results. The Range Ratio MT4 Indicator offers a solution by giving traders a clear picture of market fluctuations and volatility. With its powerful functionality, it helps traders identify potential price shifts, making it a valuable addition to any trading strategy. Let’s dive into how this indicator works and why it’s a must-have for anyone trading on the MetaTrader 4 platform.
What is the Range Ratio MT4 Indicator?
The Range Ratio MT4 Indicator is a tool designed to help traders analyze market volatility. It works by comparing the current range of price movement to the average range over a specified period. This allows traders to understand if the market is experiencing higher or lower volatility than usual, which is a crucial factor in making accurate trading decisions. The indicator’s main function is to identify periods when price fluctuations are above or below average, providing valuable insights into potential breakouts or reversals.
For example, if the Range Ratio MT4 Indicator signals that price movement is unusually large compared to its historical average, it may indicate that the market is preparing for a breakout. Conversely, when the range is smaller than usual, it could suggest a period of consolidation or low volatility, allowing traders to prepare for potential market shifts. This kind of information is essential for timing trades effectively.
How the Range Ratio MT4 Indicator Works
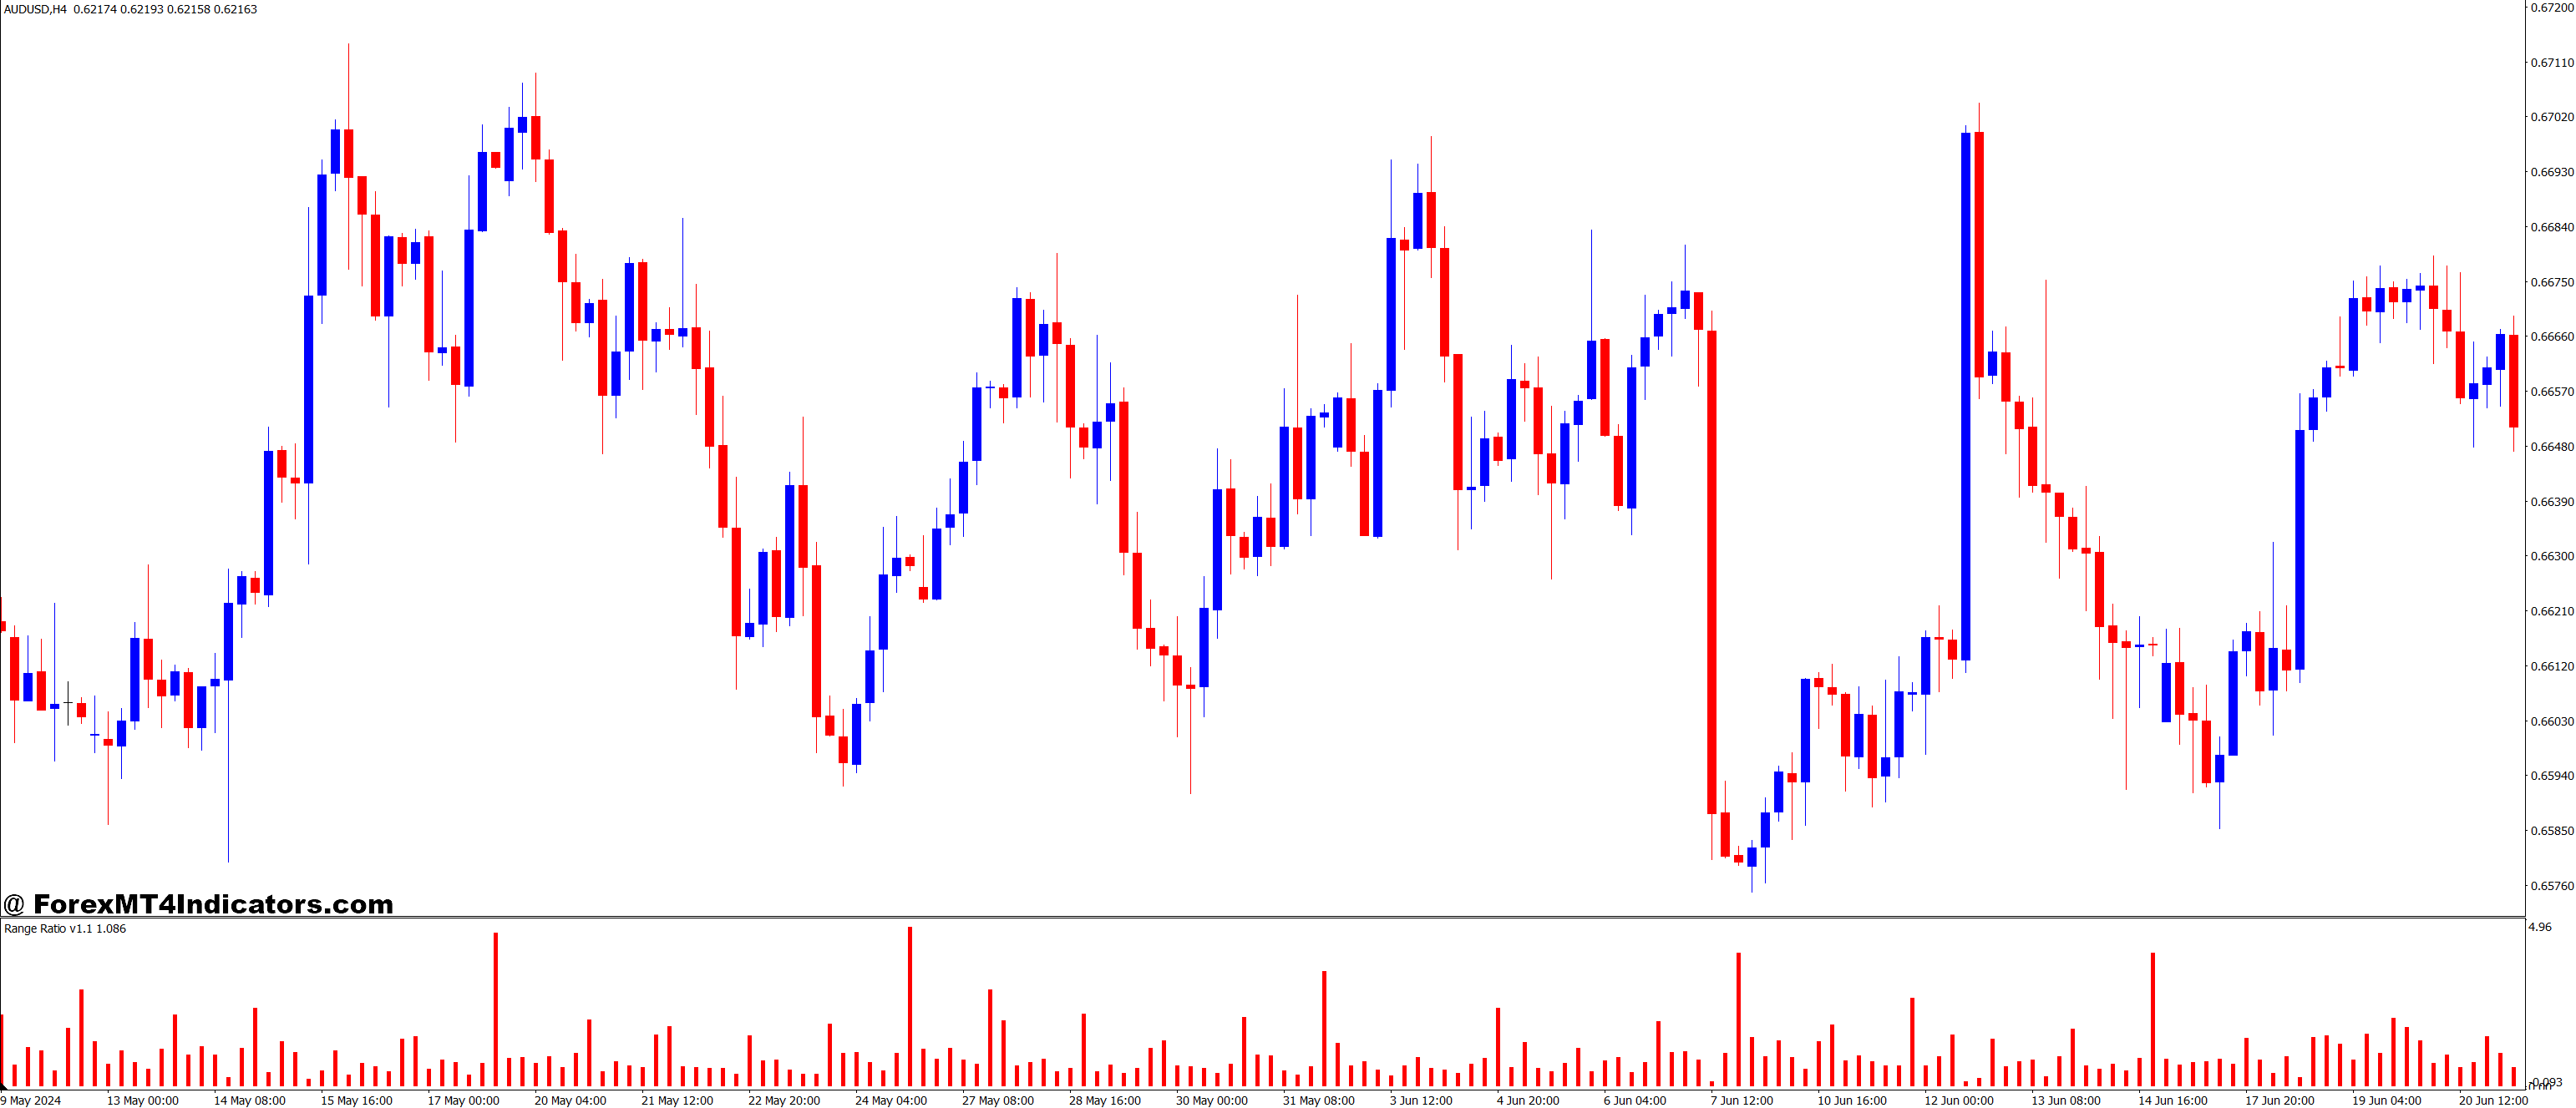
The Range Ratio MT4 Indicator is simple yet effective. It works by calculating the ratio between the current price range (the difference between the highest and lowest price during a given period) and the average price range over a set period. This data is then plotted on the MetaTrader 4 chart, giving traders an easy-to-read visual representation of market volatility.
For instance, if the current range is larger than average, the indicator will show a higher value, signaling increased volatility. If the range is smaller than usual, the value will decrease, suggesting lower volatility. This helps traders decide whether to enter or exit the market, as periods of high volatility may present more profit opportunities, while periods of low volatility may require more caution.
The Range Ratio MT4 Indicator also offers customization options. Traders can adjust the period over which the average range is calculated, allowing them to tailor the indicator to their trading style. Whether a trader is looking for short-term opportunities or long-term trends, this flexibility makes the indicator versatile enough to suit various strategies.
Benefits of Using the Range Ratio MT4 Indicator
-
Better Market Understanding: The Range Ratio MT4 Indicator provides a deeper understanding of market conditions by highlighting volatility. This knowledge helps traders avoid entering the market during periods of extreme uncertainty and focus on times when price movements are more predictable.
-
Enhanced Trade Timing: By showing whether volatility is increasing or decreasing, this indicator helps traders time their entries and exits more accurately. It allows traders to spot potential breakouts early, giving them a competitive edge in the market.
-
Simplicity and Ease of Use: One of the standout features of the Range Ratio MT4 Indicator is its simplicity. It’s easy to install and use, even for beginner traders. The clear visual representation makes interpreting the data and applying it to trading decisions straightforward.
-
Customizable to Fit Your Strategy: The indicator’s settings can be adjusted to suit different trading preferences. Whether you trade in short bursts or focus on longer-term trends, the Range Ratio MT4 Indicator can be adapted to your unique needs.
How to Use the Range Ratio MT4 Indicator Effectively
While the Range Ratio MT4 Indicator is powerful on its own, it’s most effective when combined with other technical analysis tools. Many traders use it alongside moving averages, Relative Strength Index (RSI), or MACD to get a fuller picture of market conditions. When the Range Ratio indicates increased volatility, traders may want to look for confirmation from other indicators to ensure they are making informed decisions.
Moreover, it’s important to use proper risk management practices when trading. No indicator, no matter how accurate, can guarantee profits in every situation. By using the Range Ratio MT4 Indicator as part of a broader strategy that includes stop-loss orders and careful position sizing, traders can manage risk while maximizing potential profits.
How to Trade with Range Ratio MT4 Indicator
Buy Entry
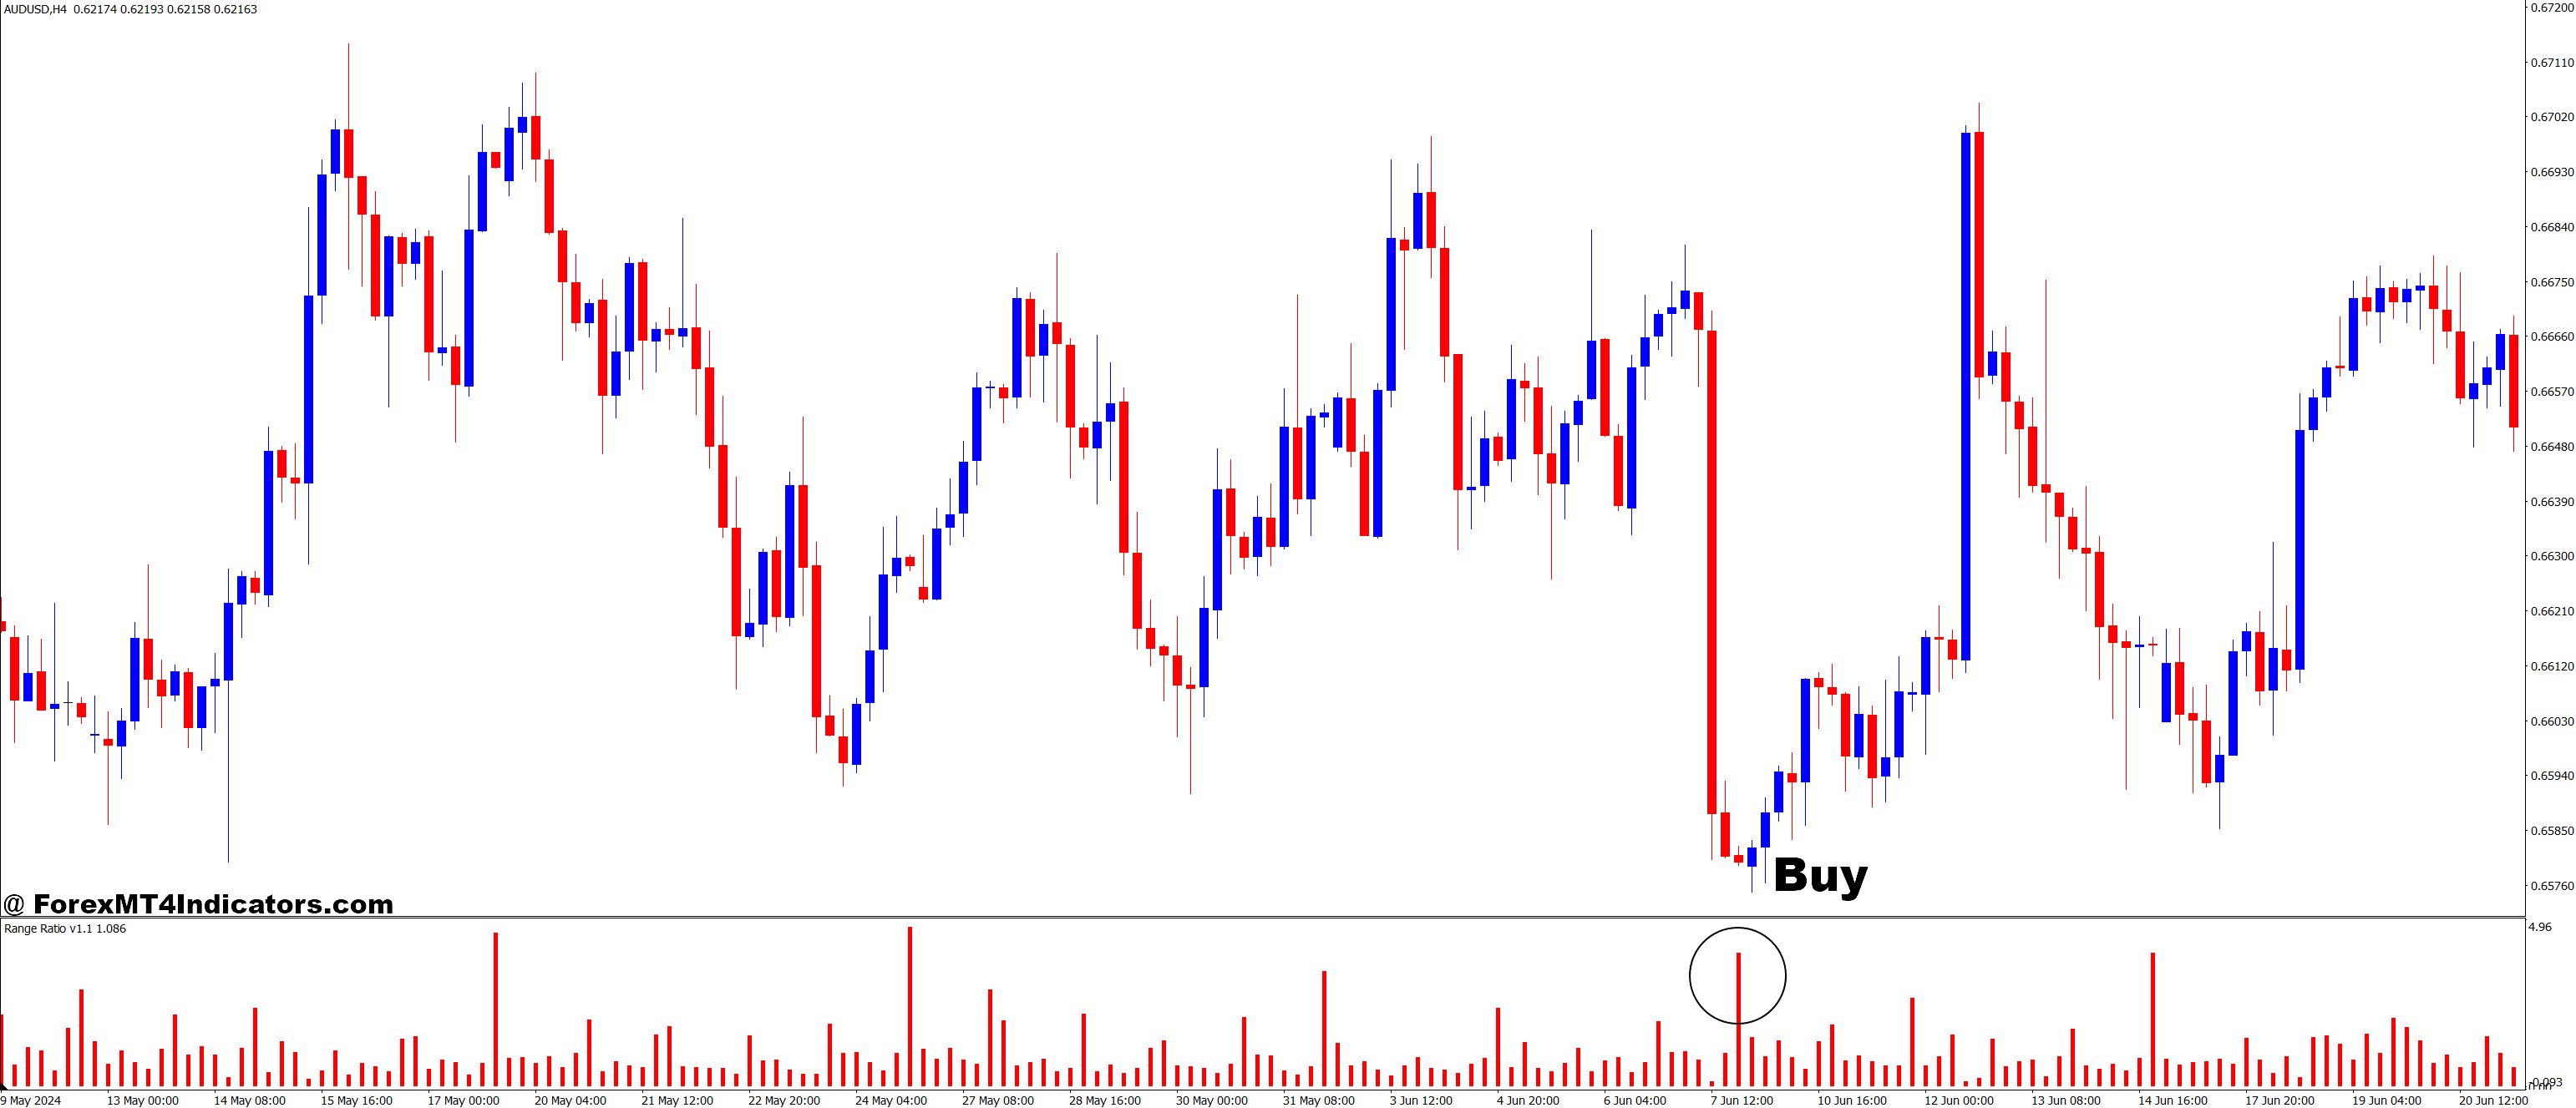
- High Range Ratio: Look for a significant spike in the Range Ratio, indicating increased volatility.
- Breakout Confirmation: Price breaks above a key resistance level while the Range Ratio shows high volatility.
- Trend Direction: Confirm that the overall trend is bullish (use a moving average or trendline to verify).
- RSI Confirmation: RSI should not be in the overbought zone (ideally below 70).
- Candlestick Pattern: A bullish candlestick pattern, like a breakout candle or engulfing candle, forms at resistance.
Sell Entry
- High Range Ratio: Look for a significant spike in the Range Ratio, indicating increased volatility.
- Breakdown Confirmation: Price breaks below a key support level while the Range Ratio shows high volatility.
- Trend Direction: Confirm that the overall trend is bearish (use a moving average or trendline to verify).
- RSI Confirmation: RSI should not be in the oversold zone (ideally above 30).
- Candlestick Pattern: A bearish candlestick pattern, like a breakdown candle or engulfing candle, forms at support.
Conclusion
The Range Ratio MT4 Indicator is a game-changer for traders who want to better understand market volatility and improve their trading decisions. Its ability to highlight changes in price range and volatility provides a clear advantage in predicting market movements and timing trades effectively. With its ease of use and flexibility, it’s a valuable tool for both beginners and experienced traders alike. By incorporating the Range Ratio MT4 Indicator into a broader trading strategy, traders can enhance their chances of success in the competitive world of financial markets.
Recommended MT4/MT5 Broker
XM Broker
- Free $50 To Start Trading Instantly! (Withdraw-able Profit)
- Deposit Bonus up to $5,000
- Unlimited Loyalty Program
- Award Winning Forex Broker
- Additional Exclusive Bonuses Throughout The Year
- Exclusive 50% Cash Rebates for all Trades!
Already an XM client but missing out on cashback? Open New Real Account and Enter this Partner Code: 𝟕𝐖𝟑𝐉𝐐
(Free MT4 Indicators Download)

Heads up – Australia switches off daylight saving this weekend
April 3, 2025 by admin
Filed under Forex Tips
Australia ends daylight saving this weekend.
Clocks will be turned back an hour on Sunday, April 6.
We call it Autumn here.
This article was written by Eamonn Sheridan at www.forexlive.com.
Source link
Bank of Japan Governor Ueda says US tariffs have raised uncertainty
April 3, 2025 by admin
Filed under Forex Tips


